

State of VC 2.0
This post is inspired by some of the earliest conversations I have had with the team here at NextView and since the beginning of my VC journey. Back in 2018, my colleague Rob wrote a blog post about how the VC asset class is doing. Given that a lot has transpired in that time, I thought it would be fascinating to take another look at some of the ideas of that post and see what has changed in the ensuing 3 years. Warning – this assumes some basic knowledge of VC performance metrics. For a primer, I would recommend refreshing yourself here. Ok, let’s jump in.
State of VC: are we in a bubble?
I have been increasingly hearing folks ask each other, “are we in a bubble?” What comes to mind is the old saying, “when your taxi driver is telling you to buy, you should be selling”. However, I am not sure that is the case with VC.
Will Quist did a great job of explaining this market rhetoric in this thread. The three-question framework goes as such:
Q: How much tech-related market cap will be created in the next 10-20 years?
A: Tech is a $5tn industry, and is only a small % of total GDP
Q: What is going to happen to the cost of capital? Are low interest rates structural, or temporal?
A: As a VC, I am inclined to say temporal and yields are bound to increase, however, I am not an economist
Q: What is the opportunity cost of not being in tech?
A: Increasing; the TTM Nasdaq P/E multiple is trading 13% higher to SPY500 (vs. 5% 1y ago) and expected to double (26%) in 1 year (forward-looking 12m)
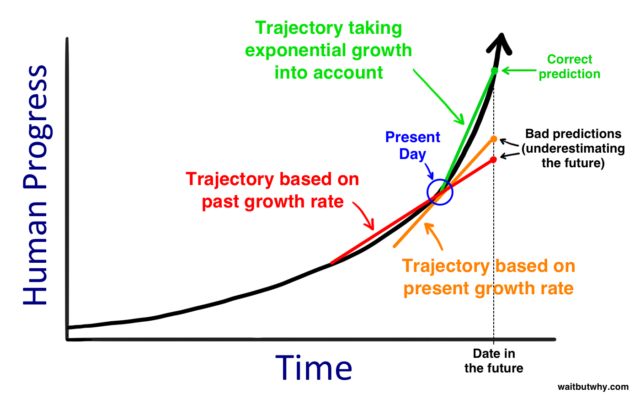
Another framing that I found to be helpful when asking this question to myself is Tim Urban’s AI article on WaitButWhy.
“When it comes to history, humans think in straight lines, linearly instead of exponentially. If someone is being more clever about it, they might predict the advances of the next 30 years not by looking at the previous 30 years, but by taking the current rate of progress and judging based on that. They’d be more accurate, but still way off. In order to think about the future correctly, you need to imagine things moving at a much faster rate than they’re moving now.”

Source: WaitButWhy
So, on one hand, the market seems like a total frenzy these days. Prices are high, multiples are bonkers, and even some long-time participants are bowing out. But perhaps the opportunity set is expanding just as rapidly (or faster) than the prices we are seeing. Maybe it feels like a bubble, but it’s just the foam from a massively rising tide lifting all boats (ok, bad analogy).
What Does the VC Performance Data Tell Us?
Let’s see if VC performance data can add anything to this question. Building off Rob’s original post, let’s continue to look at the 2007 vintage. At the time, the vintage was 10 years old, which would be considered quite mature. Today, that vintage is 14 years old. At that age, you’d expect that almost all of the investments have been realized by now. But that’s not quite the case. You can see this in the delta between TVPI and DPI.

Source: Cambridge Associates
Four years ago, TVPI was 50% higher than DPI for the top quartile fund. In other words, VC investors believed that their funds would ultimately return 50% more capital than they had 10 years into the fund life. Today, that delta is 26%. You’d expect the number to go down over time, but it’s notable that even 14 years later, VC funds are showing that a very significant % of value is still illiquid. That’s a bit of a cautionary tale to VC investors today who might think it’s inevitable that the private value they are enjoying in their portfolios will certainly translate to distributions in the near future.
What’s also interesting is that the DPI today is still less than the TVPI four years ago. So, four years later, DPI is still trying to catch up with TVPI from 2017. This begs the question – will DPI ever converge? And given that TVPI for these funds is meaningfully higher today, how long will LPs need to wait to see that value realized? Or is there a major disconnect between a portfolio’s valuations and the actual dollars returned to LPs?
How have more recent vintages performed?
What we’ve covered so far has been more of a generalized observation about the time it takes for VC funds to show liquidity and the persistent delta between TVPI and DPI. But what do we see from some of the more recent (but mature) vintages?
One thing that jumps out quickly is that TVPI between 2004-2010 (avg 2.6x) has underperformed 2011-2017 (avg 3.0x). Was this a lost decade for venture capital? Or are current values inflated and unlikely to converge with DPI? The answer is likely a mix of both.

Source: Cambridge Associates
Both early- and late-stage startup valuations are currently elevated. For context, seed-stage pre-money valuations are up 24% from H1 2020 to H1 2021. Early-stage valuations are up 70%, and late-stage valuations are up 103% (source Pitchbook). This could mean that everything is going to be ok, as Tim Urban explained. Seed investors are being compensated for the risk because later-stage investors are paying higher prices, and diluting early-stage investors less.
How are the top 5% VC funds performing versus the top 25% and median funds?
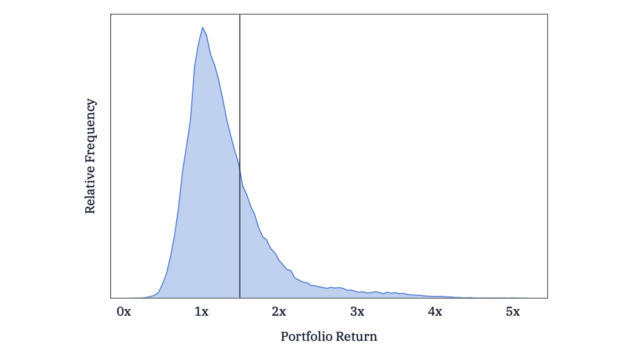
Next, I looked at how the very best funds have performed (top 5%) relative to the good funds (top 25%) and the median. This is particularly relevant for VC funds because they do not follow a normal distribution, they follow the power-law curve. The power-law curve is when the distribution of returns is heavily skewed. Or simply put, a small % of VC funds take home a large % of venture return. The chart below illustrates this, with the black vertical line representing the average VC return.

Source: AngelList
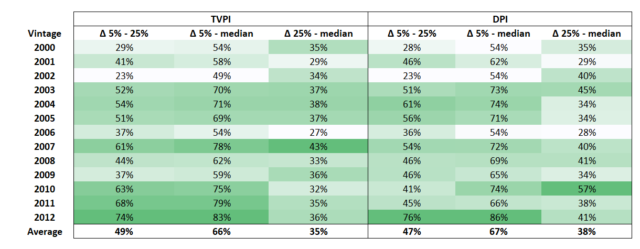
What I decided to look at is the % difference in performance between the best funds and the good and median funds. For this analysis, both TVPI and DPI are relevant to varying degrees based on the maturity of the funds. The chart below illustrates this delta by vintage year.
Note: not including vintages > 2012 because they have not been fully baked and there is some noise.

Source: Cambridge Associates
What’s interesting is that it seems the delta between the top 25% fund and the median fund has held pretty steady over time. This looks more or less true for both TVPI and DPI.
But the delta between the top 5% funds and the others seems to be increasing. This is more pronounced for TVPI but is true in terms of distributions, as well. This trend is also persisting for more recent vintages, although the effect seems greater for DPI vs. TVPI. My hypothesis is that one of the biggest drivers of extreme outperformance for less mature funds is outlier acquisitions that happen early in a fund’s life.
The key takeaway is that it seems like the top of the pack is moving further away from the rest, and the power law is increasing. Even though it seems like everyone in the industry is thriving, it’s actually a relatively small number of companies that are really accumulating massive value, and the owners of those companies are the ones that are really outperforming. Even though the number of unicorns has grown from 80 to 800 in recent years, it’s still a tiny percentage of all VC-backed companies. And only a couple dozen of them are “Dragons” as Dan Primack is now calling them.
US VC versus stocks
The last thing I wanted to look at is how this recent surge in VC performance compares to other asset classes. The performance of an asset class needs to be understood relative to other investment opportunities. A VC fund that is at 2x after ten years doesn’t feel great if the stock market has been in a massive bull market, but it might feel great if the economy overall has stalled or suffered a significant crash.
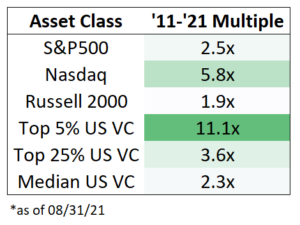
So, let’s just look back 10 years to the 2011 vintage. That’s actually the vintage with the highest TVPI for top-quartile funds, so it’s a relatively high-water mark for the venture industry right now. At that time, the market had enjoyed a decent recovery from the economic crisis of 2008, but hadn’t quite fully recovered to its highs in 2007.
The relative performance of VC vs. the public markets is quite eye-opening. The median VC fund generated about 2.3x during this time. This is less than the 2.5x of the S&P and well less than the 5.8x of the Nasdaq. You actually need to get to the top 5% fund to clear the NASDAQ, which, admittedly, has been on an insane run over the last decade.
And keep in mind that this is for an illiquid asset class, as well as one where a significant part of the value is still unrealized. Investors should expect some increased premium for the greater risk and lack of liquidity, which raises the bar even higher.

Source: Cambridge Associates (VC) & TradingView (Equities)
So, to conclude, are we in a bit of a bubble? Probably. It seems like private valuations have increased quite dramatically, and the delta between TVPI and DPI for even very mature funds seems to suggest that VCs might be banking on hope that may never materialize.
But are we also enjoying a period of unparalleled growth and opportunity led by high-growth technology companies? Probably, yes as well. We see this from the performance of the public markets and the absolute numbers generated by the venture industry. It may be overinflated to some degree, but it’s hard to deny that there is some really serious value creation that is happening in these sectors.
And, as Rob pointed out in his original post, VC is really not that great of an asset class unless you are an investor in the very best funds. The absolute return numbers might look respectable at the moment, but they still far lag the market overall. And there is some reason to be a little skeptical of very high TVPI numbers from funds that haven’t sent home significant distributions, as there is a long record of DPI not catching up to TVPI.
So, what does the future hold? Will the secular bull market in tech overwhelm the bubbly valuations we are seeing today? Or will the music stop (or at least slow down) to a point where folks who were too aggressive during this frothy time get crushed? And will the difference in performance between the best funds and the median or merely good funds continue to grow? Or will returns start to converge as the industry continues to mature? If I knew the answer to these questions, I probably would be doing something else and not writing this blog post. But as someone relatively new to the industry who is hoping to stay in it for a long time, I’m voting with my gut and am really looking forward to seeing how things unfold. Thanks for reading, and good luck to everyone!
Jack


